proctrace - a high level profiler for process lifecycle events
Posted on
Table of Contents:
proctrace is a profiler that runs on top of bpftrace (for now) and traces
the execution of a process tree rooted at a user-provided command.
Right now it records the following events and the time between them:
forkexecexitsetsidsetpgid
In the future I'd like to extend that to opening/closing/inheriting file descriptors and reads/writes.
You can find the repository on GitHub and usage instructions on the documentation site.
RustConf 2024
I'll be at RustConf 2024 in Montreal in just a few days.
If you'd like to get together and chat about proctrace or Flox,
feel free to hit me up on Mastodon or email.
The output can be rendered in a few different ways, but the most interesting one is as a Mermaid Gantt diagram (inspired by this article). If you were to clone the proctrace repo on Linux and do the following:
$ flox activate # provides dev dependencies
$ cargo build
$ proctrace record -o demo.log -b $(which bpftrace) -- ./demo_script.sh
$ proctrace render -i demo.log -d mermaid
gantt
    title Process Trace
    dateFormat x
    axisFormat %S.%L
    todayMarker off

    section 310331 execs
    [310331] /usr/bin/env bash ./demo_script.sh :active, 0, 1ms
    [310331] /usr/bin/env bash ./demo_script.sh :active, 1, 1ms
    [310331] /usr/bin/env bash ./demo_script.sh :active, 1, 1ms
    [310331] bash ./demo_script.sh :active, 1, 1ms
    [310331] bash ./demo_script.sh :active, 1, 1ms
    [310331] bash ./demo_script.sh :active, 1, 1ms
    [310331] bash ./demo_script.sh :active, 1, 1ms
    [310331] bash ./demo_script.sh :active, 1, 1ms
    [310331] bash ./demo_script.sh :active, 1, 327ms
    section other
    [310332] <fork> :active, 2, 1ms
    [310333] sleep 0.25 :active, 3, 251ms
    [310334] curl -s -X GET example.com -o /dev/null -w %{http_code} :active, 255, 72ms
    [310336] <fork> :active, 328, 1ms
then copy the output of the final command into the Mermaid Live Editor,
you would see something like this:
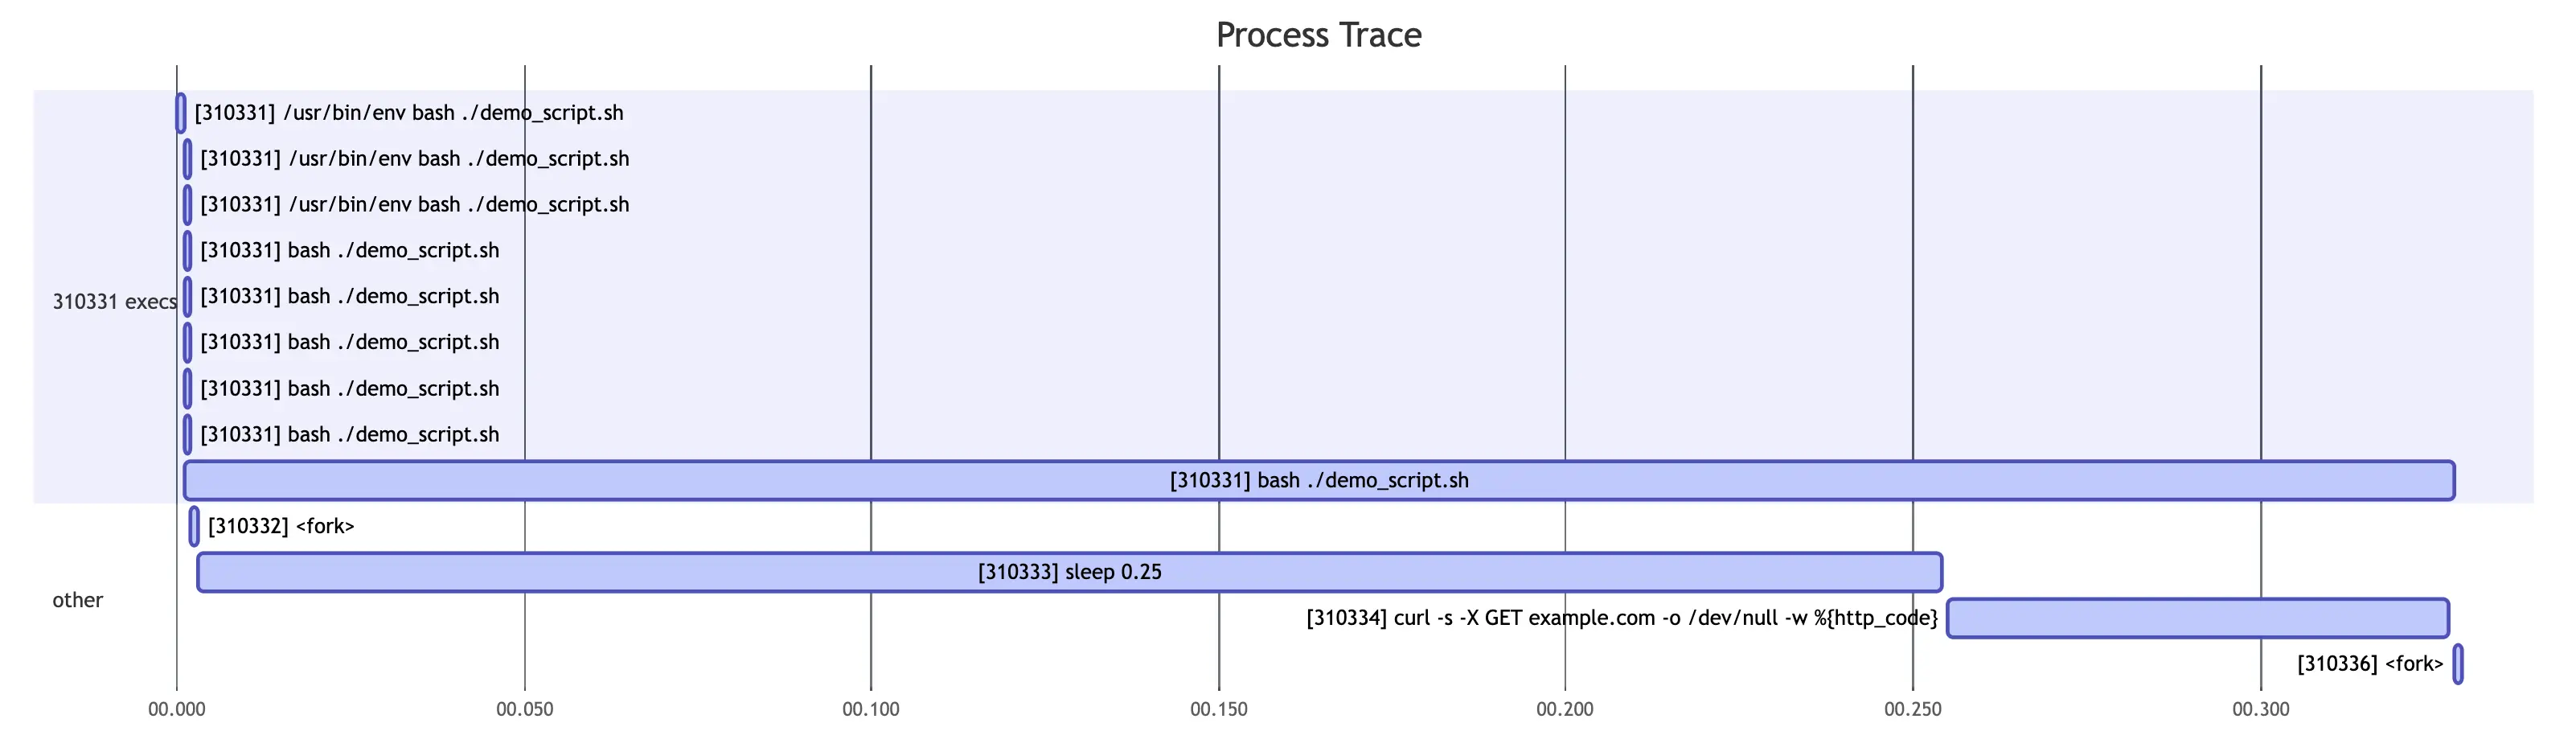
You can probably already spot some of the known bugs in proctrace from looking
at that image,
but we'll get into that later.
First, let's discuss why I wrote proctrace and what problems it's intended to solve (for me at least).
The problem
I work at Flox,
which is a new tool for setting up reproducible developer environments using
carefully configured subshells and Nix under the hood.
The idea is that you get the best of both worlds:
everything "just works" from machine to machine and developer to developer,
but you also don't have to mount in your home directory just to keep your
dotfiles like you would inside of a container.
I actually used Flox to develop proctrace,
and if you're interested in reading about what that looks like,
you can read about that here.
That's the end of the product pitch, I promise.
We recently released a feature called
"service management",
which is our take on providing long-running programs (e.g. a web server, database, etc)
to your development environment like you would with Docker Compose or
overmind/hivemind.
The difference is that we automatically clean up those processes when you leave
your development environment (e.g. close your shell).
Getting all of that working was a bit of a hassle due to the wealth of race conditions involved, the various ways in which an error could cause processes to be leaked, etc. The race conditions caused several flaky tests that would regularly cause issues for the entire test suite.
For example, since we do a lot of gymnastics to configure your shell properly we want to ensure that we have good test coverage for that. We make extensive use of bats, the Bash Automated Test Suite, for writing certain tests as shell scripts since trying to test how a shell behaves turns out to be a bit of a nightmare from something other than a shell.
matklad had helpful ideas
I'm a bit of a testing nerd and the state of our test suite really bugs me. I've been reading Alex Kladov's blog for a while, and one of the things they write about extensively is testing. At one point I reached out for advice and they were very helpful with their suggestions, but we haven't found the time to actually implement them :) That's startup life for you.
Since bats is aimed at things happening in your shell,
it captures stdout and stderr so that you can make assertions about their
contents.
This means that if you want to debug by printing/echoing,
that output would get mixed in with the output of the program under test.
bats gets around this by opening a new file descriptor (3).
When you write to fd 3,
the output is shown without being captured.
Unfortunately, it also waits for this file descriptor to
be closed before the test suite will conclude.
If a process inherits this file descriptor and is later backgrounded,
you have a perfect storm for a deadlock.
bats will happily wait forever for that file descriptor to close
while the background process happily waits for someone to clean it up.
This is a known issue
that bats warns you about (if you read the documentation),
but sometimes you make mistakes.
This issue rocked our world for a little bit when we were getting service management off the ground. We didn't have great visibility into which tests were even causing the failures (the tests all passed), much less which processes were holding on to fd 3.
I wanted to be able to quickly and easily identify which test leaked the
background process,
what the background process was,
etc.
There weren't really any tools I found that would let me do this out of the box,
so I wrote proctrace.
Design phase
Requirements
Given a PID, I need to be able to track:
- When it creates a new process via
fork - When it executes a new program via
exec - When it terminates via
exit - When it changes its relationship to other processes via
setpgidandsetsid - When any descendent process of this PID does any of the above
Once I have that process tree and events associated with each PID, I need to be able to render that information in a "useful" way.
Interface
I saw two interfaces to choose from:
- User turns on recording and events are recorded from all processes, user runs their command, user stops recording, user tells
proctraceto post-process and return the clean output. - User supplies a command, we run it for them and filter irrelevant events, then give them the clean output.
Both have their tradeoffs.
The "record everything" approach puts control flow in the user's hands, leaves them with a recording that contains more information than is necessary, and requires that they know how to do the post-processing that they need e.g. which PID is the root of the process tree. It also lets the user do multiple rounds of post-processing without the need to collect another recording.
The "do it for the user" approach requires less of the user, but doesn't allow for different types of post-processing without another recording.
As you'll see later, we're actually able to meet both of these needs, but I decided the default mode would be the "do it for the user" mode.
Event source
I knew that I had a few tools at my disposal for collecting the kinds of events
that I was looking for,
namely strace, DTrace, and bpftrace
(you know, all of the *traces).
DTrace and bpftrace have the advantage that they're scriptable and use
similar scripting languages,
so I immediately gravitated towards those tools.
One benefit of starting the command for the user is that you get to know which PID is at the root of the process tree while you're recording. The downside is that you're also responsible for starting recording before that command runs (so you don't miss the beginning of its execution), so you have to start the recorder before you know the PID. At that point it's also too late to somehow embed the PID in the execution of the tool (e.g. through templating a script or something). You could do something like issue a sentinel system call containing the PID, but that would be cursed.
Given that constraint,
the recorder will know nothing about which PIDs it's interested in and just
report events for all PIDs.
An external tool (proctrace) will consume those events and do the book keeping.
For now proctrace only supports bpftrace because there is a macOS bug
that causes your machine to hang if you run DTrace and your machine has ever
been to sleep since boot.
Putting your machine to sleep seems like an edge case to me though,
so I get it.
Termination
When do we stop recording?
To me the most reasonable answer is "when all of the processes in the tree have exited."
In the case that a process doesn't exit,
the user will need to Ctrl-C and kill the recording,
at which point proctrace should persist any data that was still in flight
and exit.
If proctrace detects that all of the processes in the tree have exited,
it will shutdown automatically.
Right now proctrace doesn't kill the process that was still running,
but there's an open issue to do this in the future.
Usage
Before we get into implementation challenges, let's talk about how you use
proctrace.
First you create a recording:
$ proctrace record -o <file> -- <cmd>
This will call bpftrace under the hood, so it will prompt for your password.
If you've installed bpftrace in a location that's only in your user's
PATH
(this is the case if you've installed via Flox or nix profile install),
then you'll need to pass in the path of the bpftrace execuable with the
-b flag.
This command will record events in newline-delimited JSON format to the specified file. It looks like this:
{"Fork":{"timestamp":874106944,"parent_pid":566940,"child_pid":566954,"parent_pgid":566939}}
{"Exec":{"timestamp":874201623,"pid":566954,"ppid":566940,"pgid":566954,"cmdline":null}}
{"ExecArgs":{"timestamp":874201623,"pid":566954,"args":"/usr/bin/env bash ./demo_script.sh"}}
{"ExecArgs":{"timestamp":874201623,"pid":566954,"args":"./demo_script.sh"}}
...
Once you have that recording you can render it in a few ways. I've already showed you the Mermaid output above, so I'll skip that.
The default render method (sequential) is to just display the events in the order that they
occurred.
{"Fork":{"timestamp":874106944,"parent_pid":566940,"child_pid":566954,"parent_pgid":566939}}
{"Exec":{"timestamp":874201623,"pid":566954,"ppid":566940,"pgid":566954,"cmdline":"/usr/bin/env bash ./demo_script.sh"}}
{"Exec":{"timestamp":875457447,"pid":566954,"ppid":566940,"pgid":566954,"cmdline":"bash ./demo_script.sh"}}
...
Notice that the ExecArgs events have been removed.
That's part of the post-processing that's done when rendering, but we'll get
into that later.
The other render method (by-process) does a similar thing except it groups
events by process and reports processes in the order that they were forked.
PID 566954: /usr/bin/env bash ./demo_script.sh
{"Fork":{"timestamp":874106944,"parent_pid":566940,"child_pid":566954,"parent_pgid":566939}}
{"Exec":{"timestamp":874201623,"pid":566954,"ppid":566940,"pgid":566954,"cmdline":"/usr/bin/env bash ./demo_script.sh"}}
{"Exec":{"timestamp":875296339,"pid":566954,"ppid":566940,"pgid":566954,"cmdline":"/usr/bin/env bash ./demo_script.sh"}}
{"Exec":{"timestamp":875354678,"pid":566954,"ppid":566940,"pgid":566954,"cmdline":"/usr/bin/env bash ./demo_script.sh"}}
{"Exec":{"timestamp":875404667,"pid":566954,"ppid":566940,"pgid":566954,"cmdline":"/usr/bin/env bash ./demo_script.sh"}}
{"Exec":{"timestamp":875457447,"pid":566954,"ppid":566940,"pgid":566954,"cmdline":"bash ./demo_script.sh"}}
{"Exec":{"timestamp":875489336,"pid":566954,"ppid":566940,"pgid":566954,"cmdline":"bash ./demo_script.sh"}}
{"Exec":{"timestamp":875526926,"pid":566954,"ppid":566940,"pgid":566954,"cmdline":"bash ./demo_script.sh"}}
{"Exec":{"timestamp":875571015,"pid":566954,"ppid":566940,"pgid":566954,"cmdline":"bash ./demo_script.sh"}}
{"Exec":{"timestamp":875602105,"pid":566954,"ppid":566940,"pgid":566954,"cmdline":"bash ./demo_script.sh"}}
{"Exec":{"timestamp":875633734,"pid":566954,"ppid":566940,"pgid":566954,"cmdline":"bash ./demo_script.sh"}}
{"Exec":{"timestamp":875674564,"pid":566954,"ppid":566940,"pgid":566954,"cmdline":"bash ./demo_script.sh"}}
{"Exec":{"timestamp":875707274,"pid":566954,"ppid":566940,"pgid":566954,"cmdline":"bash ./demo_script.sh"}}
{"Exit":{"timestamp":1204543692,"pid":566954,"ppid":566940,"pgid":566954}}

PID 566955, forked from 566954
{"Fork":{"timestamp":877599490,"parent_pid":566954,"child_pid":566955,"parent_pgid":566940}}
{"Exit":{"timestamp":877995285,"pid":566955,"ppid":566954,"pgid":566955}}

PID 566956: sleep 0.25
{"Fork":{"timestamp":878221082,"parent_pid":566954,"child_pid":566956,"parent_pgid":566940}}
{"Exec":{"timestamp":878429699,"pid":566956,"ppid":566954,"pgid":566956,"cmdline":"sleep 0.25"}}
{"Exit":{"timestamp":1129839058,"pid":566956,"ppid":566954,"pgid":566956}}

PID 566957: curl -s -X GET example.com -o /dev/null -w %{http_code}
{"Fork":{"timestamp":1130015346,"parent_pid":566954,"child_pid":566957,"parent_pgid":566940}}
{"Exec":{"timestamp":1130503480,"pid":566957,"ppid":566954,"pgid":566957,"cmdline":"curl -s -X GET example.com -o /dev/null -w %{http_code}"}}
{"Exit":{"timestamp":1203740882,"pid":566957,"ppid":566954,"pgid":566957}}

PID 566959, forked from 566954
{"Fork":{"timestamp":1203848581,"parent_pid":566954,"child_pid":566959,"parent_pgid":566940}}
{"Exit":{"timestamp":1204271226,"pid":566959,"ppid":566954,"pgid":566959}}
In a Mermaid rendering I also do some quality of life tweaks to the labels:
- Nix store paths (
/nix/store/<hash>-<name>) get shortened to<store> - Processes that were forked without later
execing are displayed as<fork>
Raw recordings
I mentioned earlier that we're able to meet both sets of needs: "do it for me" and "put me in the driver's seat". That's accomplished by taking "raw" recordings.
A raw recording is simply the recorded output of the bpftrace script.
You can do this one of two ways.
Since the script is stored in the repository and we quite literally just
write its output,
you could just run the script yourself whenever and however you want.
That output looks like this:
EXEC: ts=874201623,pid=566954,ppid=566940,pgid=566954
EXEC_ARGS: ts=874201623,pid=566954,/usr/bin/env bash ./demo_script.sh
EXEC_ARGS: ts=874201623,pid=566954,./demo_script.sh
FORK: ts=874106944,parent_pid=566940,child_pid=566954,parent_pgid=566939
EXEC: ts=875296339,pid=566954,ppid=566940,pgid=566954
EXEC_ARGS: ts=875296339,pid=566954,/usr/bin/env bash ./demo_script.sh
EXEC_ARGS: ts=875296339,pid=566954,bash ./demo_script.sh
EXEC: ts=875354678,pid=566954,ppid=566940,pgid=566954
EXEC_ARGS: ts=875354678,pid=566954,/usr/bin/env bash ./demo_script.sh
EXEC_ARGS: ts=875354678,pid=566954,bash ./demo_script.sh
...
The other way is to run proctrace record with the --raw flag,
in which case it will also tell you the PID of your command,
which you'll need for the next step:
$ proctrace record -r -o demo_raw.log -- ./demo_script.sh
...
Process tree root was PID 305101
One of the benefits of a raw recording is that you can ingest and render a process tree from a root other than the command that you actually ran. For instance, say I recorded the entire shell test suite for Flox, then only wanted to render the process tree starting at a particular test. I would need to track down that PID, but that's not terribly difficult.
To turn the raw recording into something renderable,
you use the proctrace ingest command:
$ proctrace ingest -i demo_raw.log -o demo_ingested.log --root-pid 12345
Then you would render the demo_ingested.log file as you would a normal
(non-raw? cooked?) recording.
Implementation challenges
Recording processes vs. threads
In order to start recording we launch bpftrace with a script
that's stored in the repository.
This script enables probes for certain events in the Linux kernel and then
prints formatted output that proctrace can parse.
An example of one of these probes is shown below:
tracepoint:sched:sched_process_exit
{
  $task = (struct task_struct *)curtask;
  // Ensures that we don't record threads exiting
  if ($task->pid == $task->tgid) {
    $ts = elapsed;
  	printf("EXIT: ts=%u,pid=%d,ppid=%d,pgid=%d\n", $ts, $task->tgid, $task->real_parent->tgid, $task->group_leader->tgid);
  }
}
If you aren't familiar with the inner workings of the Linux kernel,
playing around with bpftrace is actually a great way to learn.
For example,
you may not have known that threads and processes are actually represented with
the same data structure (struct task_struct).
This means that if you're only interested in process-level events,
then you need to ensure that your probes filter out events from threads.
Confusingly, each task has a pid field which is not actually the user-space
PID,
but I guess more of a generic ID for the task.
A user-space process is referred to as a "thread group".
If you want to record an event once per process you can check whether the
task that triggered the probe is the main thread of the process.
That's what the $task->pid == $task->tgid check is doing in the probe above.
Duplicate forks
Early on when I was testing proctrace on Flox I would often see a flurry
of forks when Flox started.
I knew it wasn't actually forking,
and after some investigation I determined that it was this
"thread vs. process" distinction that was missing.
It turns out that on Linux both creating new threads and creating new processes
go through the clone system call,
and silly me I guess I expected the tracepoint:sched:sched_process_fork probe
to only fire when processes fork given that...it's what the name says.
So instead of using that probe I switched to instrumenting clone directly and
inspecting the flags passed to clone that determine whether a thread or a process
gets created.
This is also an interesting system call to instrument because it returns more
than once!
It returns once in the parent (the caller), and once in the child
(the new thread or process).
In order to only capture one of these I actually have two probes for clone,
one that fires upon entry, and one that fires on exit.
tracepoint:syscalls:sys_enter_clone
{
  $task = (struct task_struct *)curtask;
  // Ensures that we don't process forks of threads
  if ((args.clone_flags & 0x00010000) == 0) {
    // Store the elapsed time:
    // - So we have a nonzero sentinel value
    // - So we can properly record the start of the fork,
    //   otherwise sometimes the exec shows up first.
    $ts = elapsed;
    @clones[tid] = $ts;
  }
}

tracepoint:syscalls:sys_exit_clone
{
  $task = (struct task_struct *)curtask;
  // Ensures that we don't record threads exiting
  if ($task->pid == $task->tgid) {
    // Don't process this clone unless we've recorded the `enter` side of it
    if (@clones[tid] != 0) {
      $ts = @clones[tid];
      @clones[tid] = 0;
      $child_pid = args.ret;
      printf("FORK: ts=%u,parent_pid=%d,child_pid=%d,parent_pgid=%d\n", $ts, $task->tgid, $child_pid, $task->real_parent->tgid);
    }
  }
}
On every sys_enter_clone we check whether we're about to create a thread,
skip it if we are,
then record both the thread ID and the timestamp.
We record the thread ID since multiple threads within a process could be calling
fork.
Then, on sys_exit_clone I check whether the task returning from the system
call has been recorded.
If it has, that means it's the thread that called fork in the parent process.
If it hasn't, that means it's a thread in the child process.
I record the result from the parent process because the return value tells us
the PID of the newly created child process.
I record the timestamp because I noticed that the fork and exec were appearing
out of order.
I don't actually know why this was happening,
but recording the enter timestamp allows us to put things back in the correct order
during post-processing.
Buffering
When proctrace is ingesting events from bpftrace it stores events in two
different event stores:
one for "tracked" events and one for "buffered" events.
The stores are identical in terms of their functionality,
they're each just a BTreeMap<i32, VecDeque<Event>> in Rust parlance.
While ingesting events if we see a fork whose parent PID is one we're already
tracking then we add the child PID to the "tracked" store.
From that point forward any events from that PID will be added to the tracked
store.
The buffered store is a response to this "fork and exec can appear out of order"
problem.
Say PID 1 forks into PID 2.
If an exec from PID 2 appears before we've seen the fork,
we will not yet have added PID 2 to the tracked event store,
and we'll discard this exec event.
Instead, we buffer this exec and when we see the fork we unbuffer all events
from the process.
We also iterate over the buffered store to ensure that any other events from
descendants of PID 2 would be unbuffered as well.
In practice I don't think the fork ever appears quite that late,
but it seemed like a good idea to be safe anyway.
Right now that buffer never gets emptied, so it just grows over time, but there's an open issue to do garbage collection.
exec arguments
There are multiple issues here.
First is that there appears to be a bug that causes bpftrace
to just fail to print the arguments.
I'm not sure what the actual limitation is,
but bpftrace doesn't seem to be able to join an array of strings and return
that as a new string to be used in a format string.
The join() function simply takes an array of strings and prints it with a
newline at the end,
so I actually have to print a single exec event as two different lines:
tracepoint:syscalls:sys_enter_execve
{
  $task = (struct task_struct *)curtask;
  $ts = elapsed;
  printf("EXEC: ts=%u,pid=%d,ppid=%d,pgid=%d\n", $ts, $task->tgid, $task->real_parent->tgid, $task->group_leader->tgid);
  printf("EXEC_ARGS: ts=%u,pid=%d,", $ts, $task->tgid);
  join(args.argv);
}
Even then that second event (EXEC_ARGS) just might not have any arguments
for me.
To mitigate this I also query /proc at runtime for each exec tracked in
a recording.
Again, there's multiple issues here.
The process may have done another exec before I query /proc and I may get
the wrong set of arguments.
The process may have exited before I query /proc and it may not have anything
for me.
I may get different arguments compared to what bpftrace reports,
and now I have to choose which arguments to show.
I haven't had time to look into why the arguments would be different, so at the moment I'm just using the longer (by joined string length) of the two sets of arguments under the assumption that the longer set has more information. I went that direction because I noticed that in most cases the arguments were the same or otherwise a subset of one another (or something like that).
Duplicate execs
Finally, the bug I mentioned at the very beginning of the article.
Sometimes I just get duplicate execs and I have no idea why.
I suspect there's an issue with the bpftrace script such that it's not filtering out
threads again e.g. sys_enter_execve is actually shorthand for
sys_enter_execve_just_kidding_this_also_fires_on_threads_too.
If you look closely, there are two <fork> events,
one before the sleep and one after the curl.
I think those are actually printf calls,
which I suppose means that we're entirely missing the exec calls for those
two events.
I've noticed this kind of behavior around things that are shell builtins,
but in that hastily thrown together demo script I specifically call
command -v printf to avoid running the builtin.
Mermaid limitations
If you have a command that contains a colon character,
Mermaid just won't render the diagram.
I've run into this with scripts that use getopt.
All it takes to get it working again is to manually go delete those colons
and Mermaid will be happy again.
Mermaid also doesn't seem to let you use arbitrary timescales,
so we're stuck using milliseconds at the moment.
For that reason I round up the execution time of each span
(e.g. time between a fork and exit, between two successive execs, etc)
to 1ms if it would otherwise be less than that.
Mermaid also seems to really enjoy stretching diagrams out horizontally
more than is necessary.
Oh well, it clearly wasn't designed for what I'm using it for.
Going forward
It's early days for proctrace and there's a lot of low-hanging fruit if you'd
like to pitch in.
Check out the Github Issues page and see what interests you.
Ultimately I'd like to generate HTML reports similar to how Cargo generates build timings reports. That would allow us to more accurately and more flexibly display the information that we already have, but would also allow us to display other information as well. For example, we already have information about process groups, so you could color each span according to the process group that it belongs to.
If you have thoughts about how to make proctrace more correct or more
ergonomic,
I'd love to hear them.